Concerns over stagnation in U.S. economy may be overblown, BBVA Compass economist says
Most people would agree that the U.S. economy’s current expansion cycle has been anemic. Since 2010, average real GDP growth has been 2.1 percent, significantly lower than 3.2 percent between 1992 and 2007. Over time, the cumulative difference between the two paths could be quite dramatic. The average person would be 17 percent less wealthy after 15 years, and 38 percent less wealthy after 30 years.

Since GDP growth can be broken down into labor, capital and productivity, most explanations focus on one or more of these categories. The persistent slowdown in labor force growth and the participation rate amid aging population are commonly used to explain a lower contribution from labor. The shift toward the digital economy is also advanced as a reason for weaker investment. With a growing number of people working from home, shopping online or working via videoconference calls, there is less need of large-scale structures like highways, shopping malls or airports. Globalization, offshoring and a greater share of service sector output, meantime, are blamed for stagnant real wages, a slowdown in the demand for low-skilled workers and worsening income inequality.
Perhaps high productivity growth should be considered atypical. Previous eras boasted extraordinary inventions like antibiotics, the combustion engine and the personal computer. Today’s text messages, smartphones and Wi-Fi may not be able to produce such gargantuan and long-lasting effects across the economy
However, the biggest challenge is explaining the significant slowdown in productivity growth, which has averaged 0.4 percent since 2011, one-fourth the rate between 1950 and 1979 and one-half the growth between 1980 and 2007. Perhaps high productivity growth should be considered atypical. Previous eras boasted extraordinary inventions like antibiotics, the combustion engine and the personal computer that had gargantuan and long-lasting effects across the economy. Today’s text messages, smartphones and Wi-Fi may never accomplish the equivalent. In addition, investment and innovation may be constrained by the lack of free markets and competition. A reduced number of large and powerful companies, mainly interested in maximizing quarterly financial results and obtaining benefits through rent-seeking discourage new entrants and reduce the incentives to start a business or invest in R&D.
Since productivity is unobservable, its estimation is conditional on the quality of measures used for output, labor and capital. Estimating these variables is not always easy, particularly when the economy is more dependent on service sector output, endures one of the deepest financial crises, experiences demographic changes, undergoes a profound technological transformation, and implements some of the most dramatic regulatory changes in modern history -- all with spiraling political polarization and policy uncertainty.
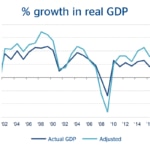
Source: BBVA Research and Haver
At first glance, the data would suggest that economic stagnation is happening. But the slowdown in productivity may be less dire than what it appears, particularly if output is underestimated. First, weaker GDP growth in the current cycle can be attributed almost entirely to the negative contribution from government spending and weaker growth in personal consumption of services. The former reflects the outcome of bitter political negotiations in the aftermath of the crisis aimed at avoiding a default on public debt and reducing real federal spending. The latter can be explained by unusual weakness in personal spending on services not traded in the marketplace and thus are imputed, such as rental costs of owner-occupied housing, financial services furnished without payment and expenditures of nonprofit institutions serving households. Between 2010 and 2015, nominal spending on financial services furnished without payment – these are the bank services that consumers pay for implicitly rather than through explicit fees, like the processing of checks or the availability of ATMs -- increased 27 percent, yet real spending declined 5 percent. In fact, the sum of these non-observable categories explain almost 60 percent of the drag to real GDP growth in 2010-2015, and excluding them would yield annual average growth of 3.5 percent in the same period. This rate is similar to 1992-2007.
Second, the post-crisis period has exhibited sharp movements in commodity prices, the value of the U.S. dollar, miles driven and consumption of motor vehicle fuels. When commodity prices were high and the dollar weak, investment in mining exploration, railroad equipment, and agricultural and oilfield machinery skyrocketed, net exports grew faster and people drove less and bought more energy efficient cars. When commodity prices declined and the dollar strengthened, investment plummeted, the trade deficit widened and people increased fuel consumption and miles driven. For example, between 2009 and 2013, real investment on mining exploration, shafts and wells increased almost 70 percent, adding 0.1 percent to real GDP growth each year. However, between 2014 and 2016, it declined more than 60 percent, subtracting 0.3 percent from real GDP growth in both 2015 and 2016.
For the most part, these trends do not reflect lack of innovation, competition or entrepreneurship, or the collapse of our institutions and business sector; quite the opposite. For example, between 2007 and 2016, motor vehicles fuel efficiency increased 24 percent while CO2 emissions declined 19 percent. Meanwhile, productivity per new oil well increased by a factor of 18 in 10 years and stands at record-high levels. Since autos and crude oil are major components of inventories, large fluctuations in stocks may not be unusual as companies implement better supply-management processes. Further adjusting GDP for these effects yields a growth rate of 3.2 percent in 2016, twice as much as the official figure.
This does not mean that we should ignore the slowdown in GDP growth and low productivity, nor dismiss official statistics of GDP. However, it does suggest that concerns surrounding stagnation and the digital transformation may be overblown, particularly since many of the components that explain weaker GDP growth are not traded in the marketplace and are subject to brinkmanship and commodity prices volatility. If an adjusted measure of output yields higher growth, productivity growth would also be higher, all else being equal. Nevertheless, this should not deter policymakers from focusing on the pressing challenges of growing income inequality, deteriorating education quality and elevated healthcare costs while maintaining fiscal stability, supporting competitiveness and achieving sustainable high growth rates.