The impact of the Mobile World Congress in a dynamic visualization by BBVA and CartoDB
BBVA's Big Data technology and CartoDB have joined together to analyze and visualize the economic impact of the Mobile World Congress of Barcelona.

This week, Barcelona is once again the world capital of mobility with the Mobile World Congress. Data show once again the importance of this event: between 25 and 28 February, it is estimated that over 70,000 people from 200 countries will contact 15,000 stands. What economic impact will this impressive movement of visitors have?
BBVA and CartoDB have prepared a visualization of the impact caused by the 2012 edition of this event, using the number of credit card transactions made in Barcelona by citizens and visitors to one of the world's largest mobility fairs.
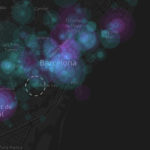
Visualization of the impact caused by the 2012 edition
The data used are completely anonymous. The system only uses the place where the transactions were performed and when they took place.
On the www.mwcimpact.com website, CartoDB and BBVA have prepared an interactive graph which compares themovements of transactions which took place in the week prior to the 2012 Mobile World Congress to those which were performed during the two-day period the event lasted.
During the 2013 Mobile World Congress fair, CartoDB will demonstrate the visualization of this technology.
In order to be able to carry out this visualization, the Big Data technology has been used with which BBVA has analyzed millions of credit card transactions to show a dynamic and interactive graph of these results. Big Data projects are one of the core areas of the BBVA innovation strategy, which has a specialized team in BBVA Innovation Center working on developing projects which maximize potential for managing digital data.
BBVA and CartoDB have worked together to produce this map which is continuously updated; the visualization uses the latest HTML5 and Torque technologies to represent all these transactions.