Big data in play in Russia
Spain is the team that controls midfield, Russia attacks the most, while Brazil surprisingly is the most defensive. According to big data, such are the styles of play of the soccer teams currently facing off in the hopes of winning the tournament.

The BBVA Data & Analytics team has carried out a study that categorizes teams and their players on the basis of their style of play. Specifically, they analyzed the three key axes of soccer tactics: attack, midfield and defense.
To study these three aspects, BBVA’s scientists adapted client2vec— an algorithm that is commonly used to enhance bank customers’ experience on the basis of individual behavior— to the soccer field. This algorithm has shown itself to be particularly useful in identifying similarities among the consumer behavior of the bank’s customers who do not share socio-demographic characteristics such as income level and where they live. “That is why we decided to use it to gauge how defensive, midfield-oriented or attacking a player is compared to their official status”, explains Leonardo Baldassini, BBVA Data & Analytics data scientist and joint creator of client2vec.
Using this algorithm –renamed player2vec for the soccer field–, the 736 players in Russia were studied one by one, grouped together by style of play, and their performance measured in all of the last three seasons’ games.
In doing so, each win, tie, or loss was weighted in such a way that if the player scored or won matches in the top-level leagues (like England's Premier League, Germany's Bundesliga, or Spain’s La Liga), he received a greater weighting in the competitiveness calculation than for a win in lesser competitions.
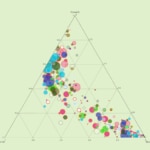
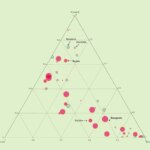
These are all the players of the major teams in the competition (most have reached round 16, but we include Germany for comparison purposes.) A similar progression can be seen across all teams, in both defensive and attacking positions. The upper left quadrant is where there is a concentration of soccer’s greatest players (the “superstars”). In many cases, an important player is associated with a “satellite” player (normally his alternate), which demonstrates the effectiveness of player2vec (and the good judgment of the head coach.)
“Superstar” close-up.
This analysis also includes goals, dribbles, successful passes, and minutes played among other variables. Using these parameters, each player has been assigned a position on the field that is most representative of his style of play — independent of the position he officially plays and with an accuracy level of 70 percent —, a competitiveness level, and a market value using data extracted from the web benchmark data source, ‘Transfermarkt’.
The sum of these individual marks is applied to an aggregate set of data for each country. One of the initial conclusions derived from the analysis is that all the competing countries are naturally inclined to play center-defense (partly for the obvious reason that there are fewer pure forwards). But, there are also striking differences between teams. Spain is the team with the most predilection to play in midfield (receiving a ratio of 31 percent in this area, above Russia with 21 percent and Argentina with 27 percent.) The data indicates that it has a greater number of players who develop plays in the midfield, players like Isco, Silva, Iniesta ... Additionally, the Spanish forwards demonstrate natural versatility in the game with cases such as Diego Costa (65% offensive and 29% midfield) and Iago Aspas (63% offensive and 25% midfield).
Russia, the team with the most attacking profile
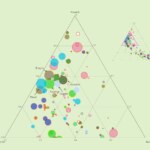
Looking at the graph above, we see how Russia, positioned at the top of the pyramid, is the most offensive team, with a 35 percent tendency for this style of play. A figure that is quite similar to Belgium, which stands just below Russia in the graph. Besides Russia's more offensive approach, these teams differ in market value, represented by the size of each circle. The Belgians have a much greater market value than the host country.
This image shows the different teams' profile according to their players' style.
Looking at the graph above, we see how Russia, positioned at the top of the pyramid, is the most offensive team, with a 35 percent tendency for this style of play. A figure that is quite similar to Belgium, which stands just below Russia in the graph. Besides Russia's more offensive approach, these teams differ in market value, represented by the size of each circle. The Belgians have a much greater market value than the host country.
In these terms, the most valuable national teams (represented by a larger circles) are France, Germany, Spain, Brazil, England, Belgium, and Argentina. A fact that doesn't usually guarantee success, since factors such as team cohesion or having a leader in the field tend to be more decisive.
A “balance” between the division of positions on the field is another factor from which we can draw conclusions, although it also doesn't have a direct correlation with chances of winning, as Germany has demonstrated. The German team received 33 percent for each of the three variants analyzed, which indicates that the team plays across offense, midfield and defense in equal parts.
Positioned not far from Germany, Mexico is another team that stands out for its versatility on the field. Its positions are represented with 26 percent attacking, 25 percent on defense, and 49 percent in midfield. A very similar situation occurs with Uruguay and France. Though, the French team does stand out as having the most valuable roster of players.
Brazil, a defensive team?
The data reveals a surprising conclusion that decidedly attracts attention. Brazil, a team historically associated with “jogo bonito” (beautiful play) and offense, turns out to be a team with a defensive profile. They spend 51 percent in the defensive half of the field as a result of having players with a supporting role profile (Casemiro, Paulinho ...) and only a few with purely offensive instincts. Only Neymar, Taison (alternate), and Gabriel Jesús exceed 50% of play as offensive players.
A similar scenario is repeated in the case of France. Big data assigns the French team, in addition to Mexico and Uruguay, a center-defensive profile. These are teams that are very difficult to attack; they tend to always entrench themselves in their defensive positions. According to the results of the study, this should also be the case for Colombia, Switzerland, and Portugal.
BBVA's analysis also allows for play profile comparisons between two countries facing each other in a match. Using data visualization, – created by BBVA Data & Analytics visual storyteller, Iskra Velitchkova – the study lets users navigate to a face-off between teams to explore how the combination of each team’s characteristics might play out at game time. Below we will analyze two of the most featured battles, but first you can compare team profiles here for upcoming games.
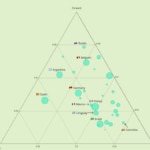
Analysis of Argentina vs. France
In this graph, each vertex of the triangle represents a zone in which a player is 100 percent defensive, 100 percent in the midfield, or 100 percent on the attack. Additionally, the size of the circle represents a player’s market value. The further away from the vertex, the more versatile the player is.
This graph represents the Argentina vs. France game.
Defensive players are clustered in the right-hand vertex, where more notable French players can be seen than Argentine players. As a result, France is a more solid team and has more “balanced” players than its competitor. On the Argentine team, Messi stands out above the rest as the offensive leader of Sampaoli's team. Additionally, Argentine's number 10 is the player of the match – and of the tournament – with the greatest market value (€180 million), as can be seen by the size of his circle.
Other names of significant impact in the game, according to their style of play are Thauvin, Matuidi, Pogba, and Kanté for France. On the other side, Messi, Higuaín, and Meza could be destabilizing forces on behalf of Argentina.
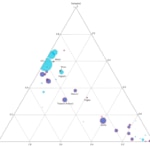
Analysis of Spain vs. Russia
This graph shows where the Spanish and Russian players position themselves according to their defensive, midfield, or offensive profiles. Spain will pass Russia in round 16 according to both its competitiveness ratio (550 for Russia compared to 750 for Spain) and the market value of its players. The sizes of the Spanish players’ circles are bigger, especially singling out Busquets (worth €80 million), Isco and Asensio (€75 M), and Koke and Saúl (€70 M). On the Russian side, Golovin (€18 million) and Smolov and Fernances (€16 M) are the most notable in terms of market value.
This one shows the profiles of Spain and Russia's teams.
Russia, the team the data points to as having the most offensive profile, has leading players like Kokorin and Smolov; whereas the Spaniard, Aspas who scored the key goal in the last game of the qualifying rounds, could again be a deciding factor. The analysis indicates that in this theoretical match, he could easily play his type of game.
For this study, the team at BBVA Data & Analytics used the playing field to demonstrate how data science tools can work to help us understand and explore aspects of our daily life. “This research forms part of our efforts to spread knowledge about algorithms, making them more transparent and understood, in addition to underscoring the power of data to better understand our world around us.” indicated Marcelo Soria, BBVA Data & Analytics head of strategy